A. Engauge Digitizer - Digitizing software;
B. The Ipe extensible drawing editor;
C. MS Paint - a little drawing tool on Microsoft Windows.
1. Extract the plot as an image file.
This step is quite easy if the paper is already in the pdf format. Open the pdf, enlarge the plot, make a screen capture, paste the capture into MS Paint, cut the plot area, paste the plot into a new file in MS Paint and then save the plot into an image file. But you need to first scan the paper into an image file if it is only a Xerox photocopy. After that, proceed with the scanned image in the same procedure as those for the pdf file.
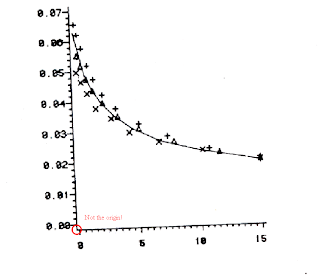
2. What if the plot is rotated and has undefined coordinates origin?
This could be a rare case but it did happen to me. Here is an example...
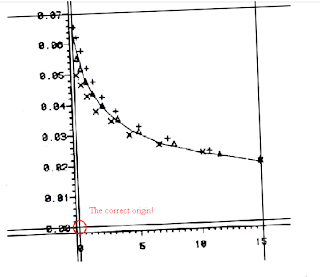
 So I used the Ipe drawing editor to define a better coordinate system for the above plot...
 Please refer to the Ipe manual on how to do this.
3. Data extraction
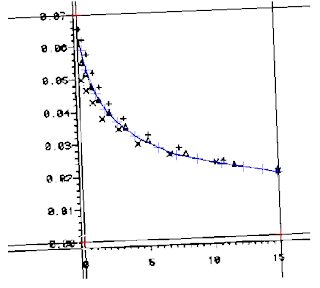
This step is simple enough. Import the plot image into the Engauge Digitizer, define the coordinates with three points (red crosses), set data points (blue crosses) on the curve in the plot, and then extract the data values into a .csv file.

Job done!

